If you’ve ever tried to observe real-time price changes of stocks or any other financial instrument using technical analysis, you may have heard or come across candlestick patterns.
While it seems intimidating to interpret, you can easily learn candlestick patterns if you have a good understanding of the basics and use them correctly in the actual market.
In simple words, a candlestick is a method of displaying information about a security’s price movement. It compresses data from multiple time frames into a single bar and is one of the most popular technical tools to quickly interpret price information and make informed decisions as a trader.
How to Read a Candlestick Pattern?
A candlestick mainly has three basic features:
- The body – It shows the close and open
- The wick – It indicates the high and low for the day
- The color – It reveals the price movement. A green (or white) candle indicates a positive movement, and a red (or black) indicates a negative movement
A daily candlestick pattern reflects the open, high, low, and close (OHLC) of the market in general of the instrument you have chosen such as stocks or derivatives. Once a candlestick pattern is formed, it indicates the potential moves that as a trader you can use as a leading indicator to plan your trades.
Types of Candlestick Patterns
To learn candlestick patterns, you also need to learn their types. While there are many types of patterns, let’s have a look at the popular ones.
- Bullish Candlestick Patterns
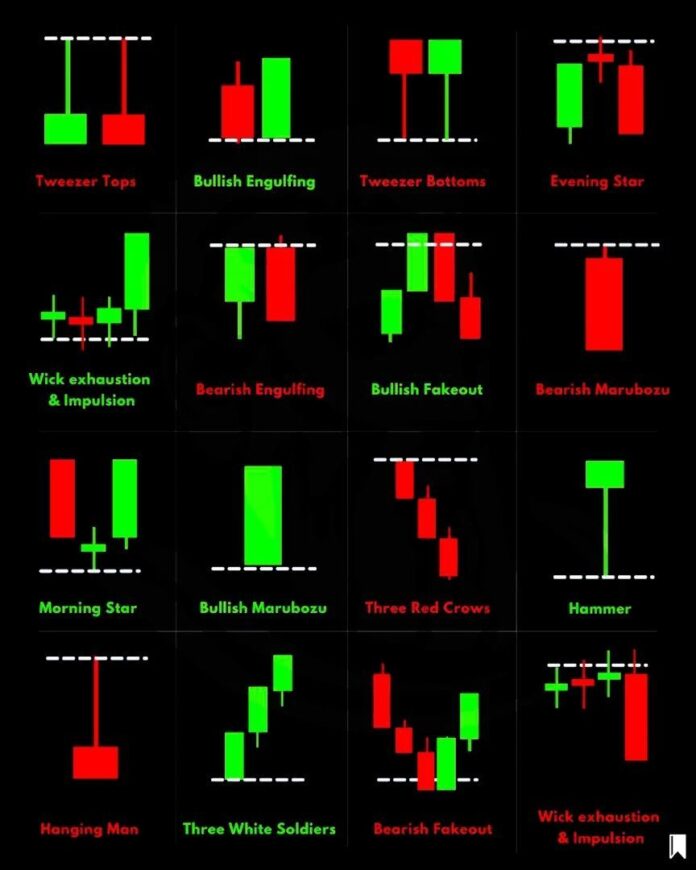
Bullish candlestick patterns form after a downtrend, more specifically at the bottom of the downtrend. It signals a reversal from the current price movement. You can use this as an indicator to generally take long positions in your preferred instrument such as stock, options, etc.
There are many bullish candlestick patterns, however, the most popular are the hammer, bullish engulfing, inverted hammer, three white soldiers, morningstar, etc.
- Bearish Candlestick Patterns
Just like bullish patterns indicate an up move, bearish patterns indicate a down move – thus, the name bearish. Bearish candlestick patterns are generally formed at the top of an uptrend, suggesting a change in the current market direction.
Some of the prominent bearish candlestick patterns are hanging man, shooting star, bearish engulfing, three black crows, evening star, etc. Traders confirm the pattern formation and take short positions to benefit from an impending downtrend.
Want to Learn More?
The above information about candlesticks is surely intriguing, however, with so many candlestick patterns it can be challenging to choose the one that works for you. To make it easier, there are many online learning platforms such as Upsurge.club that offer online trading courses.
Taking a course on this niche can help you to understand the dynamics of candlesticks and help you become market ready. It will also close the gap between theoretical knowledge and practical implementation and help you elevate your trading game.
Conclusion
Candlestick patterns have been around for centuries and as a trader, you can use this as a powerful tool for technical analysis. Understanding candlestick chart patterns is an essential skill whether you are a beginner or a seasoned trader.
Candlesticks provide a clear and concise way to interpret price information and make informed decisions. By learning the basics of candlestick patterns, you can leverage potential market moves with ease. So, what are you waiting for? #hydnews #hydkhabar #livehyd


